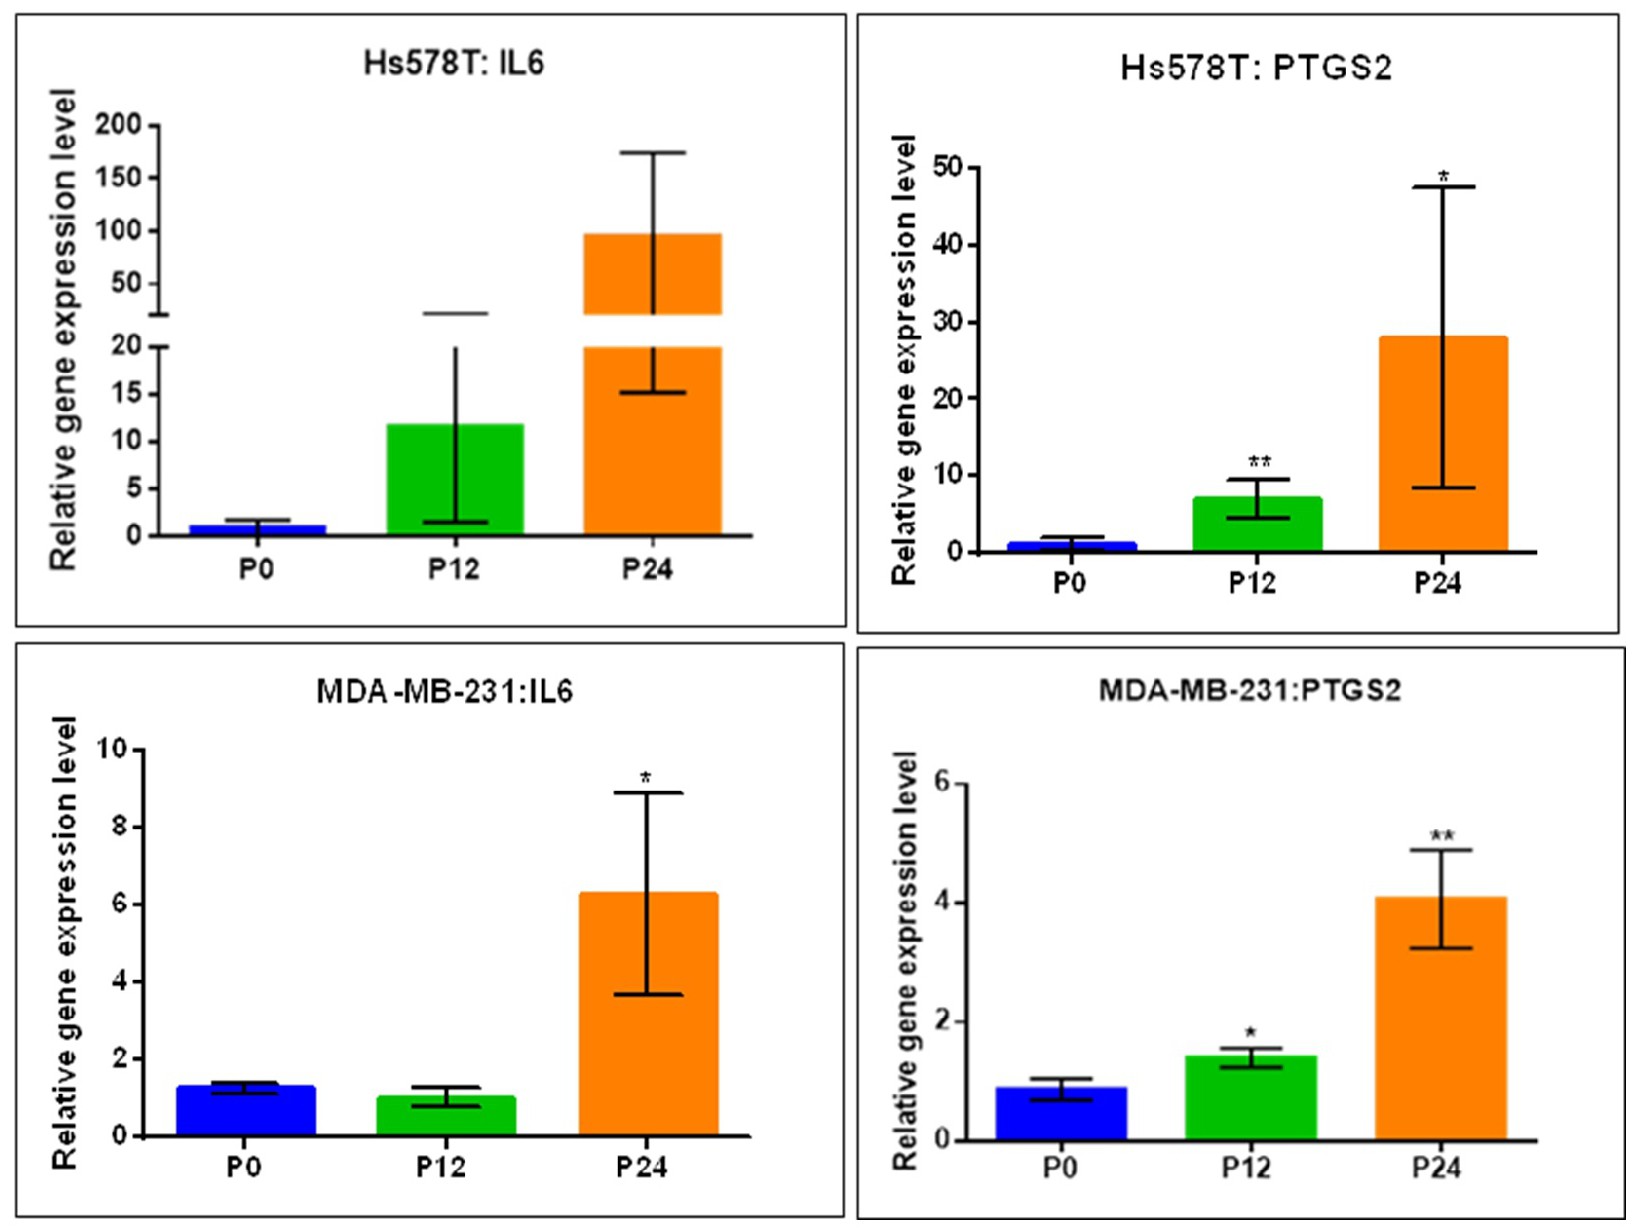
Fig. 9. Validation of microarray data through qRT-PCR technique. Gene expression profiling was investigated for IL-6 and PTGS2 at P0, P12 respectively P24 on both cell lines, Hs578T/Pax and MDA-MB-231/Pax; qRT-PCR results are normalised using 2ΔΔCT method using B2M and GAPDH (*P ≤ 0.05, **P ≤ 0.01).